Global Market Graph

A single source of truth for macroeconomic trends and disruptions

graph illustration

News that is not the same

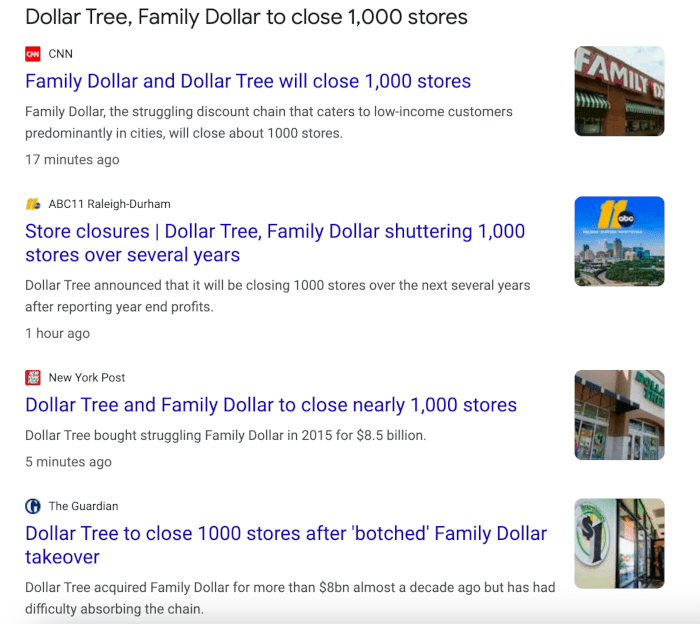
The sad fact is that news has been commoditized. Most news sites publish content that is almost identical to everyone else. It is written for search engines, cluttered with ads, and provides little insight.

Why it matters: Your news must inform, analyze, and explain economic events beyond the immediate horizon.

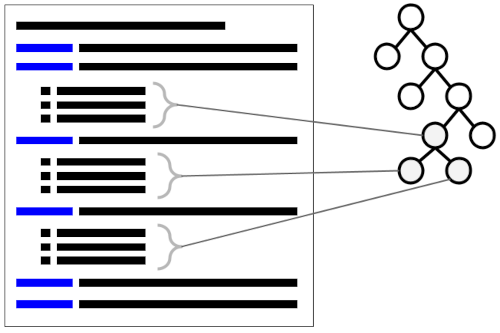
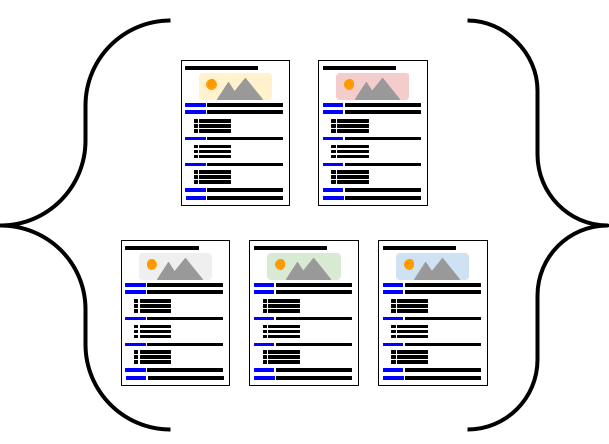
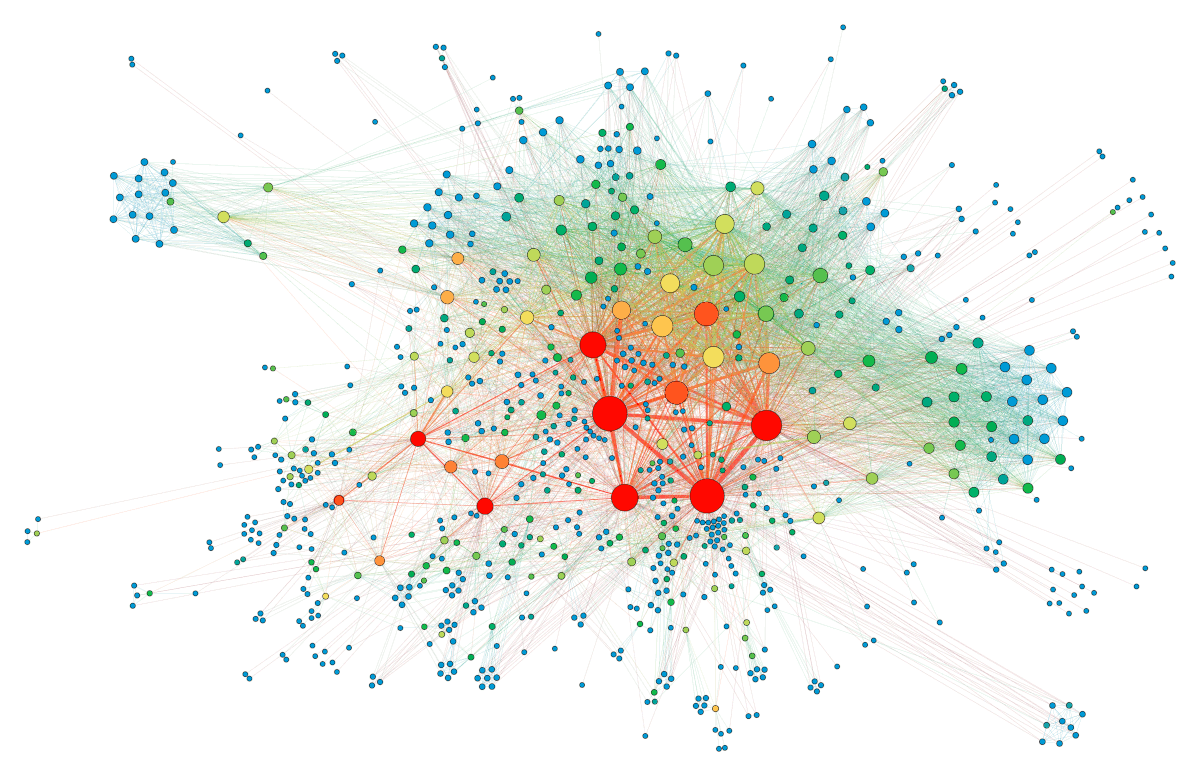
The big picture: Banananomics puts the audience first with insights from a single source of truth: the global market graph.

Go Deeper to see it in action.

graph illustration

Datasets

5712

News Outlets

78

Markets

54

Impact [Trillions]

$19

How it works

The Banananomics AI reads thousands of financial datasets and articles to measure their relationships and include them in the global market graph.

Why it matters: Each relationship is proven with evidence to ensure that only the most accurate information is presented.

Between the lines: Instead of opinion, Banananomics presents facts from the global market graph in the most engaging way possible.

Go Deeper to see it in action.

article and graph illustration

Connect to the graph

Banananomics provides data from the global market graph through an API.

Why it matters: Quickly discover the financial relationships that impact you the most.

Zoom in: Use GraphQL to connect the global market graph to Excel, Python, and other applications.

Contact Us to learn more.

api illustration